Markets
Goldman raises S&P 500 target, expects Fed cuts to boost market multiple
(CSA Archive/Getty Images)

Wall Street says chase the rally, with Goldman and BofA upping S&P 500 price targets

Goldman Sachs expects high valuations to persist thanks to Fed easing, while Bank of America trumpets the resilience of corporate earnings.

Goldman Sachs Chief US Equity Strategist David Kostin and his team lifted their price targets for the S&P 500 (SPDR S&P 500 ETF) to 6,900 from 6,500 in a new research note, suggesting a roughly 11% increase for the blue chips over the next 12 months. They wrote:

“Earlier and deeper Fed easing and lower Treasury yields than we previously expected, the continued fundamental strength of the largest stocks, and investors’ willingness to look through likely near-term earnings weakness support our revised S&P 500 forward P/E forecast of 22x (from 20.4x).”

The tango between yields on US Treasury bonds — and expected rate cuts from the Federal Reserve — is a complicated (and passionate!) one. (I got into the weeds of it here, for those interested.)

But in the interest of time, think of it like this: all else equal — and yes, all else is never perfectly equal, but let’s pretend — lower bond yields translate into higher market multiples, foremost among them the fabled price-to-earnings ratio. So if earnings stay stable, and bond yields are lower than expected, multiples rise and the market price, in this case the S&P 500, goes up — at least on paper.

And Goldman is penciling in S&P 500 earnings per share essentially on a steady 7% rise over the next 12 months, even amid the large uncertainties related to the Trump administration’s ongoing tariff frenzy.

“Company commentary shows S&P 500 firms plan to use a combination of cost savings, supplier adjustments, and pricing to offset the impact of tariffs,” they wrote.

To put it another way, the panic that accompanied the massive tariffs announced by President Trump in early April — which pushed the S&P 500 to the brink of a bear market — hasn’t been justified, at least so far. Inflation hasn’t gone nuts. That leaves the Fed room to cut, and the economy, which is the key driver of corporate earnings, seems to be more or less hanging in there.

Bank of America market analysts had a similar takeaway in a note published Tuesday. They upgraded their previously bearish price target for the S&P 500, raising it to 6,600 over the next 12 months from 5,600, implying a gain of about 6%, citing the resilience of corporate earnings.

“Corporate transparency has remained intact. Most co’s have continued to guide on profits, and estimate dispersion (a measure of EPS uncertainty) is near post COVID lows,” they wrote.

For the record, that doesn’t mean the market was wrong to panic after the president announced plans to raise America’s trade barriers to levels not seen in a century.

If those tariffs went through as initially announced, they likely would have done a ton of damage. But, of course, they didn’t go through, as the famously improvisational president backed away from the initial announcement within days and muddied the water with weeks of delays, adjustments, carve-outs, tweaks, Truth Social blasts, and nontransparent dealmaking that has significantly muted and obscured the impact of Trump’s trade policy of choice.

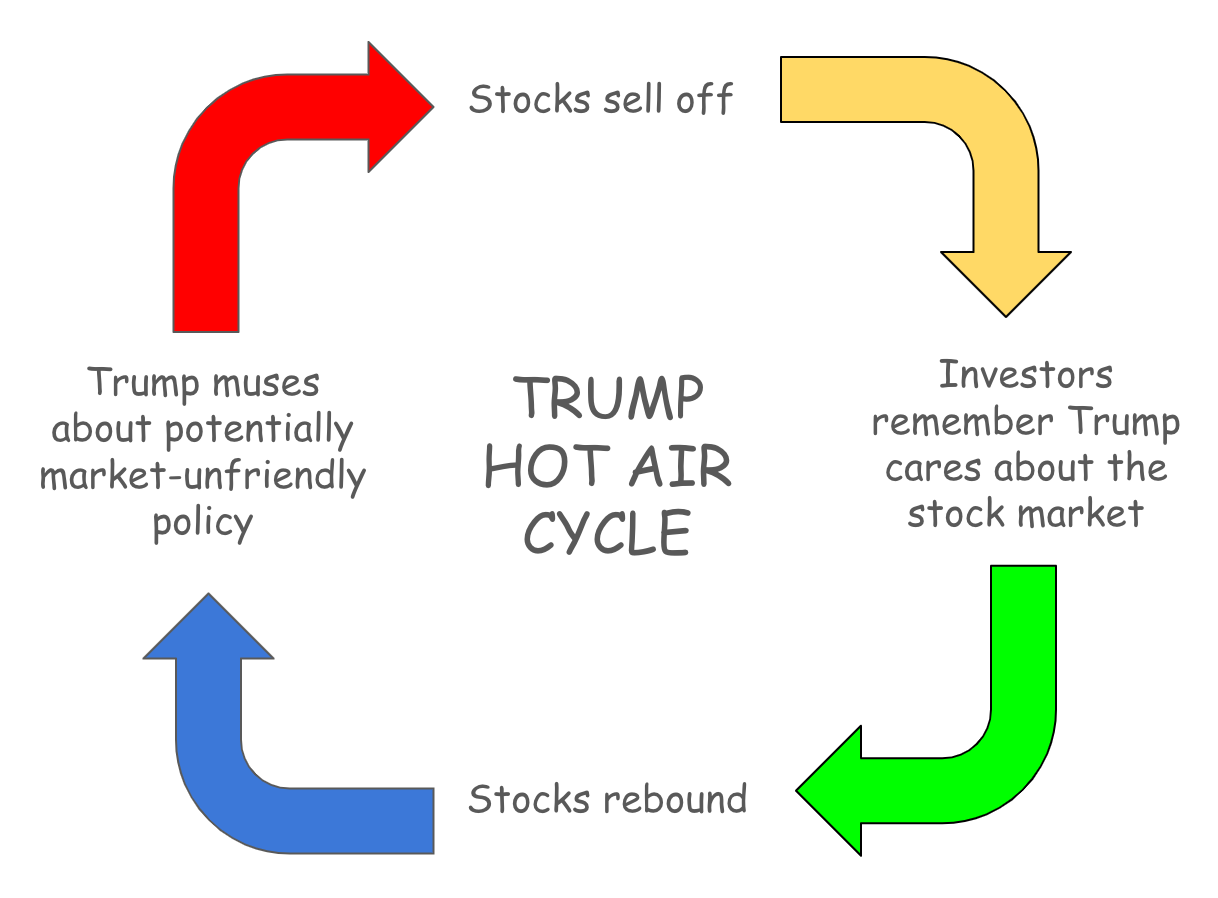
Or as my colleague Luke Kawa might have put it, the market failed to take into account the role that the Trump Hot Air Cycle continues to play in Trump 2.0.

Trump Hot Air Cycle
Source: Sherwood News

More Markets

See all Markets
markets

Intel’s earnings send fellow CPU sellers Arm and AMD higher

A strong set of Q1 results and Q2 guidance from Intel is sending shares of fellow CPU sellers Arm Holdings and Advanced Micro Devices about 6% and 4% higher in postmarket trading, respectively.

Intel’s robust report is seemingly a rising tide that lifts all boats in the industry, not just a company-specific dynamic.

Arm recently pivoted to designing and selling CPUs for data center customers (like Meta!) in addition to its long-standing business of licensing out the design architecture.

And AMD, of course, has been a well-established giant in the space before it ever started offering GPUs.

It’s the latest reminder that the AI boom isn’t just juicing demand for the most advanced chips, but also memory, older-school units, and a wide array of hardware.

markets

Intel crushes Q1 earnings expectations, forecasts strong Q2 revenue, shares soar

Intel shares surged in after-hours trading Thursday after the semiconductor giant reported much better-than-expected Q1 earnings and sales numbers, as well as robust guidance for Q2.

Intel reported:

  • Q1 revenue of $13.6 billion vs. a consensus expectation for $12.42 billion.

  • Adjusted earnings per share of $0.29 vs. the $0.02 consensus estimate from FactSet.

  • A forecast for Q2 sales of between $13.8 billion and $14.8 billion vs. analysts’ $13.11 billion expectation.

  • A forecast for adjusted Q2 EPS of $0.20 vs. Wall Street expectations for $0.10.

“The next wave of AI will bring intelligence closer to the end user, moving from foundational models to inference to agentic. This shift is significantly increasing the need for Intel’s CPUs and wafer and advanced packaging offerings,” Intel CEO Lip-Bu Tan said in the company’s earnings release.

The quarterly result was clearly a surprise to both analysts and investors. Shares were up 15% shortly after the report in after-hours trading — despite having risen roughly 50% already in the month of April before the results were released.

Intel’s results could not be more different from the previous quarter. In its Q4 report, Intel issued lackluster guidance for Q1, which it blamed on a dearth of available silicon wafers it could use to make finished chips. The stock plunged 17% the next day.

“Intel was explicit on the Q4 call that they were living hand-to-mouth on wafers,” Cody Acree, a senior semiconductor analyst at brokerage firm Benchmark/StoneX, said in a brief phone interview with Sherwood News Thursday. “If this kind of upside was possible, than why the ultraconservative guidance?”

The Q1 results are a significant coda to what has been one of the best periods of share price performance for the company in decades. The stock has more than tripled over the last 12 months.

That run-up, however, had seemed to far outpace Intel’s actual business results, resulting in a nosebleed-inducing forward price-to-earnings valuation nearly 100x expected earnings over the next 12 months, dwarfing even the valuations the company was receiving during the peak of the dot-com boom of the 1990s. But the Q1 numbers suggest the market was picking up good vibrations that seem to have been borne out.

markets
Saleah Blancaflor

The national average of US gas prices drops to $4.03

Drivers can breathe a small sigh of relief... for now. The national average gas price has gone down $0.06 since last week to $4.03 per gallon, according to the American Automobile Association.

The national average was at $4.09 per gallon a week ago.

Meanwhile, US crude oil prices have gone under $100 per barrel, which has played a part in helping drive down the cost of gas for customers. But how long the downward trend will continue remains uncertain due to instability along the Strait of Hormuz.

Loading...
 

(Event contracts are offered through Robinhood Derivatives, LLC — probabilities referenced or sourced from KalshiEx LLC or ForecastEx LLC.)

Gas prices are currently the highest theyve ever been this time of the year going back to 2022, when the national average was $4.11 on April 23.

As we head into the end of April, prediction markets currently show traders pricing in an 81% chance the price of gas could still rise above $4.10 by the end of the month.

markets

This chart shows how Donald Trump is the king of stock market volatility

Well, here is an absolute banger of a chart from Fundstrat that is sure to simultaneously please and annoy everyone:

Macro data scientist Alex Wang’s chart on the causes of the five best and worst market days during different presidencies demonstrates how much the Oval Office has driven US stock market volatility during President Trump’s second term in office.

Fundstrat up and down days by presidency

My very loose, abstract description of what policymakers do is “try to make things better.” (As for what constitutes “things” and “better,” well, tens of millions of Americans will have to agree to disagree.)

Most of the time, these things the president and Congress pursue are not a massive shock to the financial system, though there’s always a doomsayer warning that something like Obamacare will spell the end for US stocks. And that means most of the time, you can probably expect a positive skew: policymakers will be coming in with stimulus to support the economy and markets in the face of unexpected downside.

Per Fundstrat’s analysis, that clearly hasn’t been the case in the past 15 months. You can look at this one of two ways. Perhaps this period has been a time of such economic stability and impressive earnings growth that some of those other catalysts for massive one-day drops haven’t materialized. We’re blessed to have gotten to enjoy such a solid backdrop! Or you could suggest this is indicative of a fundamentally more activist presidency and more frequent policy decisions that carry higher macroeconomic consequences compared to previous presidencies. We’re doomed to swing wildly based on what we see next on Truth Social!

There have been a lot of wonderful studies released by asset managers on the importance of not missing the 10 best days in the market in any given year. (It’s less often mentioned by folks who have a vested interest in you investing your money about how much better returns would be if you miss the 10 worst days of the year!) The problem is that these sessions are typically clustered so close together that it’s an impossible task to navigate twisted, volatile waters so cleanly.

The upshot: Trump-induced volatility has been noise, with the biggest five losses nearly perfectly canceling out the biggest gains. There’s an underlying non-Trump, mainly AI trend that’s mattered, and that’s probably the main reason the US stock market is where it is.

Latest Stories

Sherwood Media, LLC produces fresh and unique perspectives on topical financial news and is a fully owned subsidiary of Robinhood Markets, Inc., and any views expressed here do not necessarily reflect the views of any other Robinhood affiliate, including Robinhood Markets, Inc., Robinhood Financial LLC, Robinhood Securities, LLC, Robinhood Crypto, LLC, Robinhood Derivatives, LLC, or Robinhood Money, LLC. Futures and event contracts are offered through Robinhood Derivatives, LLC.