


Palantir’s valuation: Just how insane is it?
There are few precedents for a such stratospheric market value — $350 billion — being as precariously balanced on such a narrow base of earnings and revenue.
Palantir is one of the most insanely valued companies in recent market history.
Hyperbolic? Maybe. Strictly speaking, it is possible to find money-losing small caps, biotech long shots, or penny stocks that look even loopier on some basic valuation metrics.
But in terms of real companies — we’re talking large-cap, profit-producing members of the blue-chip club known as the S&P 500 — there are few precedents for a such stratospheric market value, at $350 billion, being as precariously balanced on such a narrow base of earnings and revenue.
That doesn’t mean a price collapse is imminent. But it does mean Palantir faces expectations that will be incredibly difficult to meet, and the risks of disappointment are acute. That’s something shareholders — especially those who have gotten onboard the Palantir bandwagon relatively recently — should understand.
But, let’s start with the good news. The defense data and AI software company has had a remarkable run over the last couple years. In the past 12 months, it’s up more than 400%, making it far and away the best performer in the S&P 500.
It’s also the top gainer for the index in 2025 so far, which puts it on track to be the S&P’s best performer for the second straight year. Its 340% gain also topped the list last year.
The problem, if it is a problem, is that everyone already seems to love the stock — a lot. The near mania means Palantir’s shares have risen far faster than Palantir’s admittedly strong business has grown. (More on that later.)
Statistically speaking, that means widely used metrics known as valuation ratios — so-called multiples like price-to-earnings and price-to-sales ratios that have long served as a fast analytic measure of whether investors are paying too much for a stock or getting it at a bargain price — have gotten remarkably high.
You can think of price-to-earnings ratios as a barometer of just how wildly excited (high ratios) or downright disinterested (low ratios) the market is about a company and its potential growth.
The TL;DR? Palantir is clearly the most “expensive” stock in S&P 500 by the most widely used measures. Here are the top stocks in the index ranked by their price-to-earnings multiple.
The euphoria is even more obvious if you look at price-to-sales ratios — the gauge of choice for younger companies that don’t always post quarterly profits. (Remember, Palantir has only been GAAP profitable, that is, profitable according to rigorous accounting, for the last two years.)
Palantir bulls would argue that there are good reasons for all the excitement. And they have a point. Palantir’s business, a combination of a large and expanding contracting relationship with the US government and a high-margin, fast-growing business selling software that helps corporations use AI technology, has been revving.
Year-on-year sales growth clocked in at roughly 40% last quarter, and earnings per share almost doubled thanks to gross margins of about 80%. For the full year, analysts expect Palantir to post sales growth of 35.9%, putting it in the top 3% of the S&P 500 in terms of growth expectations. And the Street expects sales growth of 28% in 2026, putting it, essentially, in the top 1% of growers. Palantir is clearly a remarkable business running like a top, and its future looks exceptionally bright.
Clearly the stock market gives extra credit for growth. But not this much credit! And Palantir isn’t the only company out there growing fast. It’s valuation is vastly inflated compared to other companies — even massively important tech companies like Nvidia — that are also growing insanely fast.
OK, let’s say Palantir’s valuation is insanely high. But so what? Haven’t a lot of great companies had insanely high valuations as baby blue chips? Yes. Several of the greatest companies and investments in recent memory — the Googles, Microsofts, Amazons, and Teslas of the world — were all once “wildly overvalued” by conventional metrics, yet they nevertheless created many trillions of dollars in market wealth in the intervening decades.
Yes, but. Even at their frothiest, most wildly euphoric market moments — say, during the tech boom of the late 1990s for Microsoft — none of those corporate giants had valuations like Palantir’s. Not even even in the same ballpark.
That’s not to say there are no valuation comps for Palantir. But they might not be ones Palantir investors will be especially thrilled to see. If you go all the way back to the peak of the tech stock bubble on March 10, 2000, there are several candidates.
On that day — the Nasdaq closed at a peak it wouldn’t see for 15 years — dot-com darling Yahoo! Inc., an internet portal, was carrying a price-to-sales ratio of more than 78x, almost exactly where Palantir currently sits. Network Appliance Inc., or NetApp, which made data storage devices to run the then nascent internet, was carrying a multiple of 74x sales.
But those companies, with market caps of $93 billion and $36 billion, respectively, or $175 billion and $67 billion in today’s dollars, were nowhere near as big as Palantir is today. That matters. It means a lot less investor wealth was tied up in those high valuations. And by the way, those valuations did not last.
Yahoo!’s valuation adjustment wasn’t the good kind. Its share price collapsed 90% during the dot-com bust, vaporizing about $90 billion in shareholder wealth in a year. NetApp, likewise, fell as much as 95% during the worst of the bust.
But perhaps those aren’t the best comps for Palantir, a company that has positioned itself to be at the epicenter of an investment boom in a new technology — AI — expected to dominate the economy for decades.
Conveniently, back in the dot-com days, there were a couple of massive, highly valued companies (though still not as high as Palantir!) in a somewhat analogous position.
Cisco, which sold the routers and communications kits needed to wire up America’s online economy in the late ’90s, is one of them.
The tech boom sent the company’s shares on a tear. They rose more than 1,000% between the end of 1996 and early 2000, when Cisco briefly became the most valuable company in the world. At its peak, Cisco’s valuations were pretty wild, if not Palantir-sized, with a price-to-sales multiple of 24x (compared to 2x for the S&P 500 as a whole) and a price-to-earnings ratio of 131x (comped to 26x for the index).
Then it all came crumbling down. During the bust, Cisco’s value collapsed by almost 90% over the next two years, wiping out about $450 billion in wealth. (That’s almost $800 billion in today’s money.)
But Cisco never retook its position as a market darling because its sales growth never returned to dot-com levels. That’s not to say Cisco’s sales didn’t grow; they just grew at a much slower rate. And it’s still a large, successful company. It’s just that those who bought into the peak of the Cisco frenzy would never have made any money.
Those hoping to buy into Palantir at this point should give this some thought. The expectations that Palantir faces over the next few years are if anything a bit higher than what Cisco analysts were expecting during the peak of that era’s investment boom in a hot new technology — the internet, instead of AI today. Just how high?
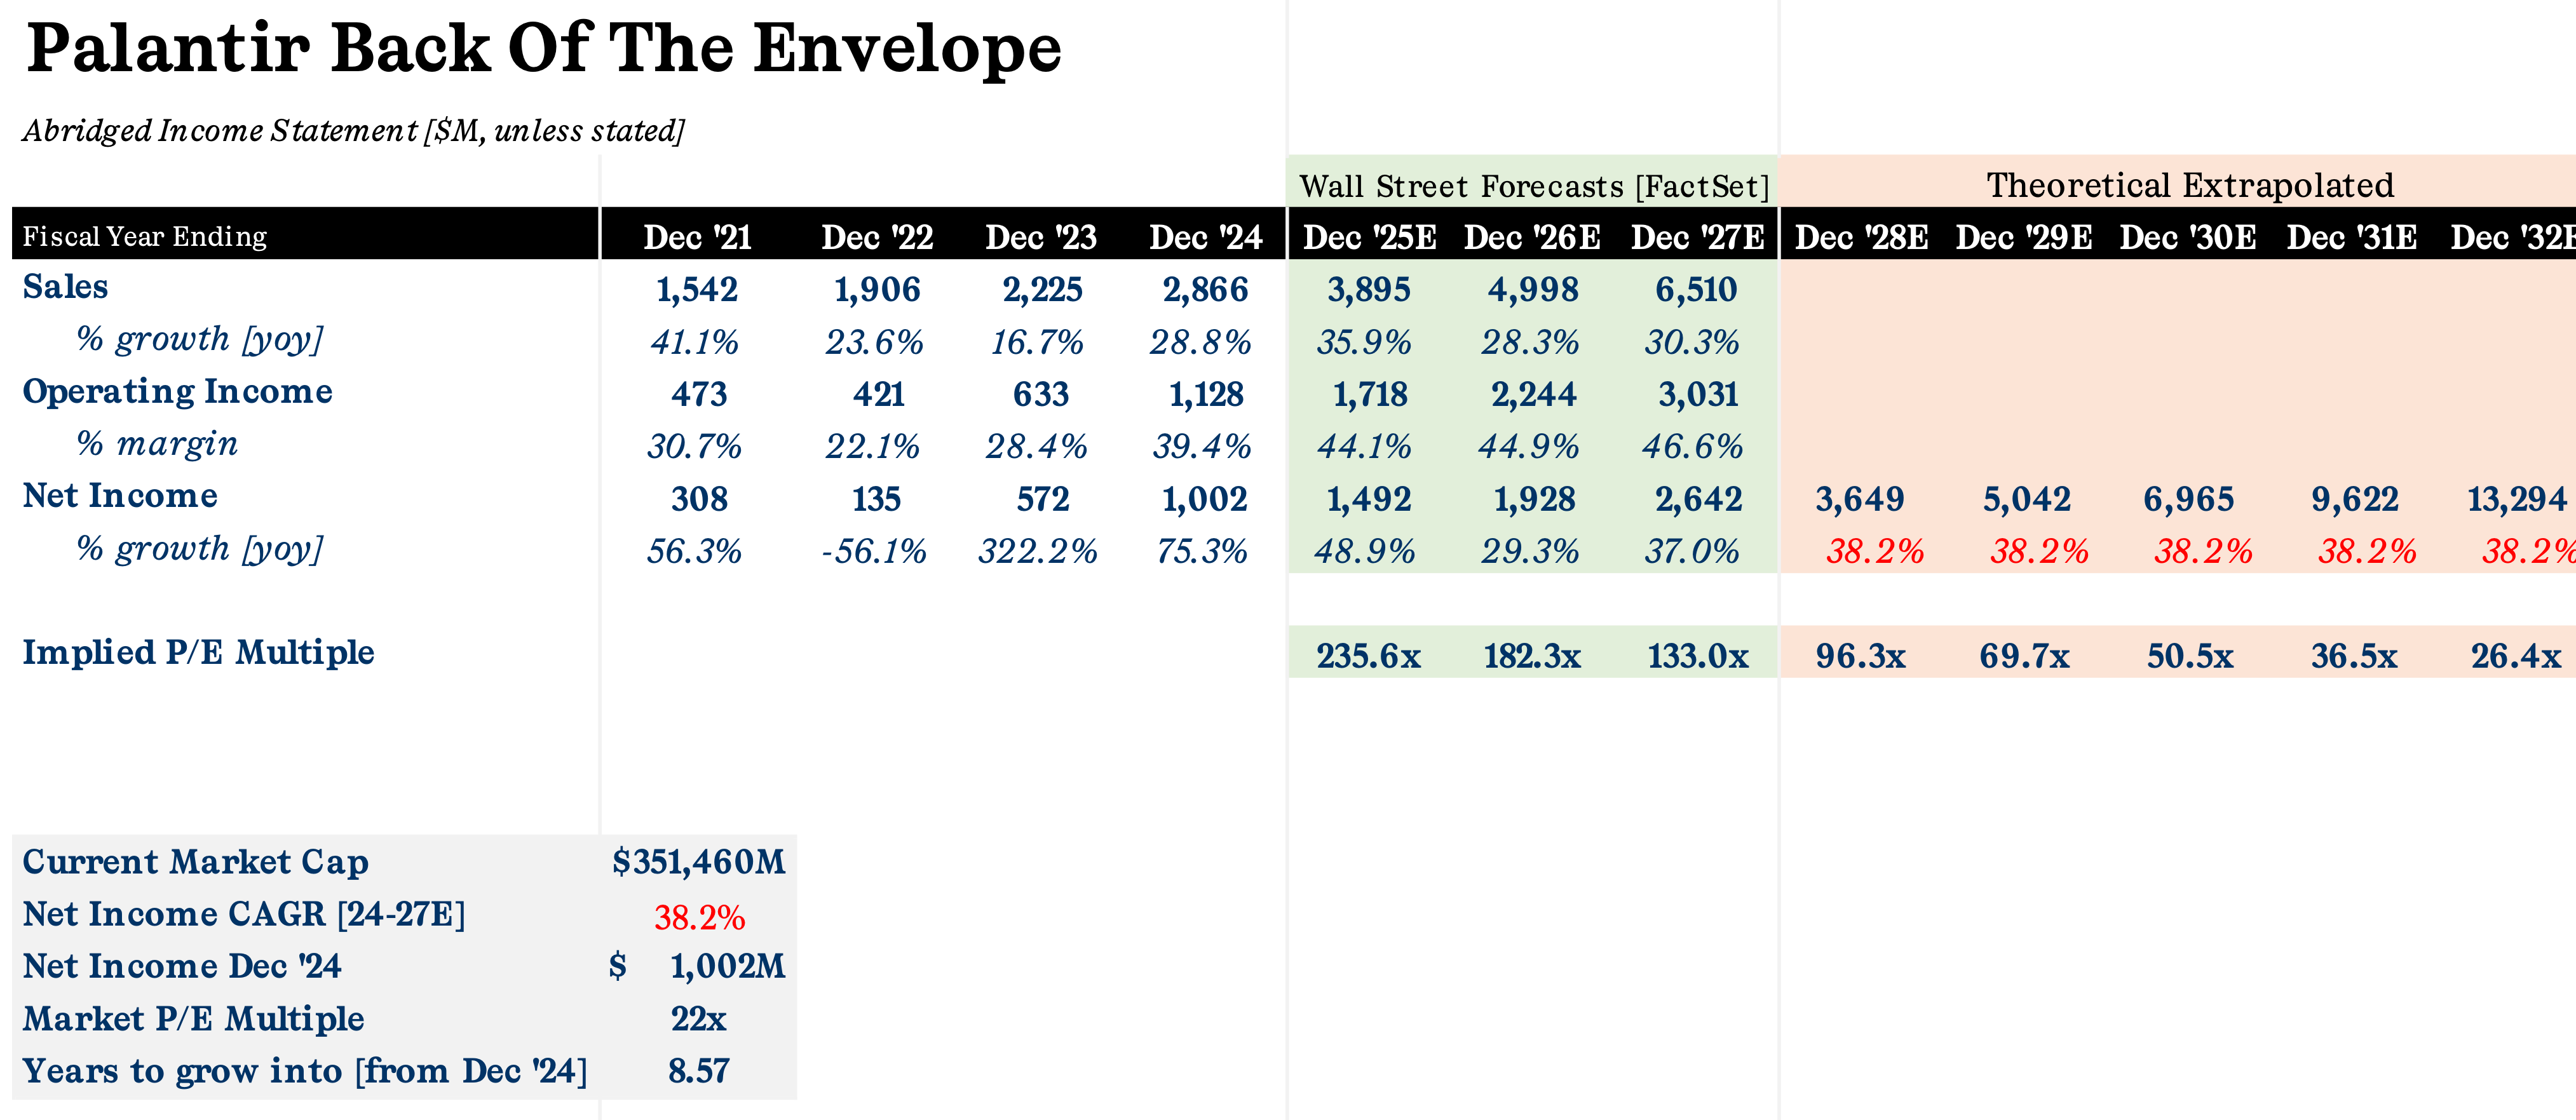
We can do some classic back-of-the-envelope equity analysis (the best kind) to get an idea of the kind of results that would be required for the company to “grow into its multiple.” Put another way, assuming the company continues to grow at lightning speed, how long would it take until the company is trading on a “normal” price-to-earnings ratio (which we’ll take as the S&P 500’s 22x for now).
The bottom line is that Palantir would have to grow its non-GAAP net income — that’s what’s used to come up with its price-to-earnings ratio — by almost 40% a year for nearly nine straight years for its multiple to return to the neighborhood of the market as a whole. That’s an incredibly difficult level of profitability to maintain.
Another potential comp — and a more positive one, from the perspective of Palantirians — is Oracle. Like Palantir, it’s a big business software company (though Palantir’s larger business is its government contracting division).
Oracle attained a large valuation during the dot-com boom, when at its peak in September 2000 it was worth roughly $259 billion. That’s about $450 billion in today’s money, so it was also bigger than Palantir is now.
On the other hand, its multiples were never as high as Palantir’s. And it still suffered during the dot-com bust, as growth faltered. Investors who bought into the peak would spend years underwater.
But importantly, Oracle was able to get its sales growth rates back up. That, combined with gross margins of about 70% and as well as a propensity to buy back shares, have made Oracle a massively good investment over the last decade, and a relatively solid store of value for investor capital, if they could ride out the long, lean years.
So, what’s the takeaway here? The easy one is that Palantir has a nosebleed high valuation, the likes of which you usually only see in a period of irrational market exuberance. That’s a fact that even die-hard fans of the stock need to confront.
And a corollary to that observation is that in the past, when some companies were priced like that — even if they were great companies — they’ve seen their price nosedive, especially if sales growth shows any sign of slowing.
In other words, someone buying into a stock at moments of super high valuation in the hopes of making a fast buck could be setting themselves up for either a loss, or years with an investment that is underwater. That’s the story of Yahoo! and Cisco.
On the other hand, the experience of Oracle — or Microsoft or Amazon, for that matter — suggests that sometimes companies with hideously high multiples can suffer a stock price plunge, as all those companies did during the tech bust of the early 2000s, and then see their investors’ early faith in the company be rewarded as the companies perform incredibly well over the longer term.
In a way, you could argue that for those stocks, their durability proves out the initial enthusiasm that pushed valuations to peaks in the first place.
-David Crowther contributed to reporting this story.


