Nobody agrees on whether Philadelphia’s Super Bowl win is good or bad for the stock market
The perils of low-n analysis.
Depending on which data set you choose — or which way you squint — the Philadelphia Eagles’ drubbing of the Kansas City Chiefs either portends a boom in the US stock market, or doom.
Whether the result of the Big Game is bullish or bearish is a bit of a choose-your-own-adventure activity, though, unlike Cooper DeJean, I’m not sure you can pick six here:
It’s bearish stocks because forward returns when the Chiefs win have been better than when the Eagles won:
rooting for the Chiefs based solely on the fact that S&P 500 is up +16% in years they win Super Bowl (4x) while it was down -6% the one time Eagles won the Super Bowl pic.twitter.com/nCzWaRCim7
— Trung Phan (@TrungTPhan) February 9, 2025
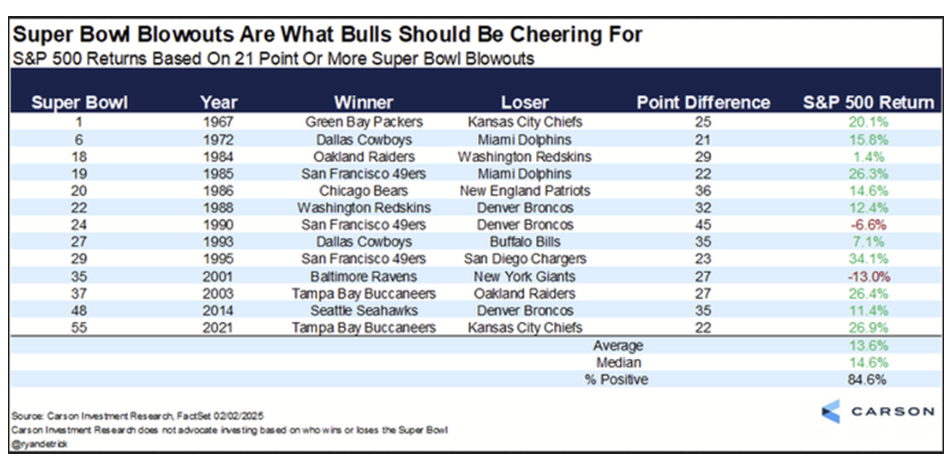
It’s bullish because blowouts in the Super Bowl are good for stocks:
It’s bearish stocks because Philadelphia sports success is bearish stocks:
The single most reliable and consistent indicator of weakness in stocks.
— TSDR Trading (@TSDR_Trading) February 10, 2025
A Philadelphia Sports Franchise winning the Championship.
The Philadelphia Eagles are currently winning 24-0 in the Super Bowl.
Data below to support. pic.twitter.com/hFCAdERvqf
It’s bullish because the Eagles are from the NFC:
$SPY Eagles are NFC.
— Brent Ericson (@brent_ericson) February 10, 2025
S&P is higher on average when NFC wins the Super Bowl.$QQQ $TLT pic.twitter.com/0DToBSXHnz
(Hat tip to Dave Lutz, equity sales trader and macro strategist at Jonestrading, for flagging some of these for us! And no offense to anyone above, unless you’re being serious about all this, in which case...)
Why does any of this matter? Well, the fun with numbers shown above is actually a shining example of a form of analysis that’s quite common across Wall Street, in which quasi-statistical analysis is used to give a veneer of sophistication to an otherwise flimsy thesis.
One of my big pet peeves when it comes to markets prognostication is the use of low-n analysis (n being the variable typically used to denote the number of observations in a sample). The worst offenders, of course, are the analog charts, but those are far from the only transgressors.
Simply, the world does not provide many opportunities for controlled experiments to be conducted when it comes to the intersection of catalysts, macroeconomic conditions, and asset price reactions.
There have only been a handful of business cycles since the US went off the gold standard. The changing composition of indexes over time — say, the emergence of biotech as a major industry in US small-gap gauges — makes historical comparisons between what on the surface would appear to be the same thing into an apples-to-oranges scenario. We only seem to use the phrase “generationally high inflation” once every three generations. And don’t get me started on the use of overlapping datasets that were used to explain why a major second wave of price pressures was seemingly written in stone…
Low-n analysis is more of a comfort blanket than it is part of any reasonable thesis.
When Heraclitus said, “No man ever steps in the same river twice, for it’s not the same river and he’s not the same man,” he was offering a metaphysical lesson of particular relevance to financial market analysis.
Personally, all of my worst trades have come from using enough math to make myself feel more secure in a future that decidedly did not come to pass, because the world simply failed to behave the way it had in the past. Who among us didn’t double down into the quality factor amid its early 2022 retreat?
If history rhymes, it’s much in the same way that Eminem can make words rhyme with orange: it’s a function of an expert putting in serious time and effort to identify partial patterns that are pleasing to the ears.