TVs don’t actually cost 98% less than they used to... and other inflation misconceptions
We spoke to Bureau of Labor Statistics inflation expert Steve Reed to understand exactly what goes into the inflation statistics we hear so much about.
It’s still the economy, stupid
By now, we’ve all heard, said, or read one of several versions of the exact same hypothesis: President-elect Donald Trump romped to victory in the election because America had grown sick of feeling the painful pinch of inflation.
Whether the tariff-heavy policies of the incoming administration will keep a lid on higher prices is unknown, but one thing that is inevitable is that inflation will be a hot-button issue for years to come.
What we talk about when we talk about inflation
Let’s start with some basics. Per the Bureau of Labor Statistics, inflation is the “overall general upward price movement of goods and services in an economy,” which seems simple enough, but misconceptions about the inflation data that the BLS publishes each month are still rife.
The most commonly cited measure of inflation in the media, and indeed in economics, is the Consumer Price Index. A gargantuan theoretical basket that contains over 80,000 goods and items from milk and pizzas to rent and energy bills, the CPI is pretty much always the figure that Americans refer to when they discuss whether “inflation is up (or down).”
As we’ve discussed before, one of the biggest disconnects between what economists care about (the bleeding edge of the latest monthly data) and what normal people care about (is my grocery bill more this week than I remember it used to be?) is a simple issue of measurement.
Sticker shock
Furthermore, some individual items are simply more prevalent in our collective minds, and end up capturing the attention of consumers and columnists alike. Take butter, for instance, or eggs: price rises for everyday staples such as these are more likely to spark conversation and stick in the collective American craw than the full shopping cart of goods and services in the CPI.
Gas prices, too. As Kyla Scanlon wrote in her book “In This Economy?” published earlier this year, “bright neon signs on every street corner remind us of how expensive it is to be alive.” It’s little wonder such everyday items are so often linked to the national economic sentiment.
Clearly, the process for tracking the price of everything isn’t easy. In many cases, Bureau workers will — based on data from its regular Consumer Expenditure Surveys — visit certain stores to take monthly measurements of how much groceries cost, or scour America’s biggest pharmacies to assess whether we’re having to spend more on average to buy new medication this month than we were just four weeks earlier. For other goods, some more considered calculation is required.
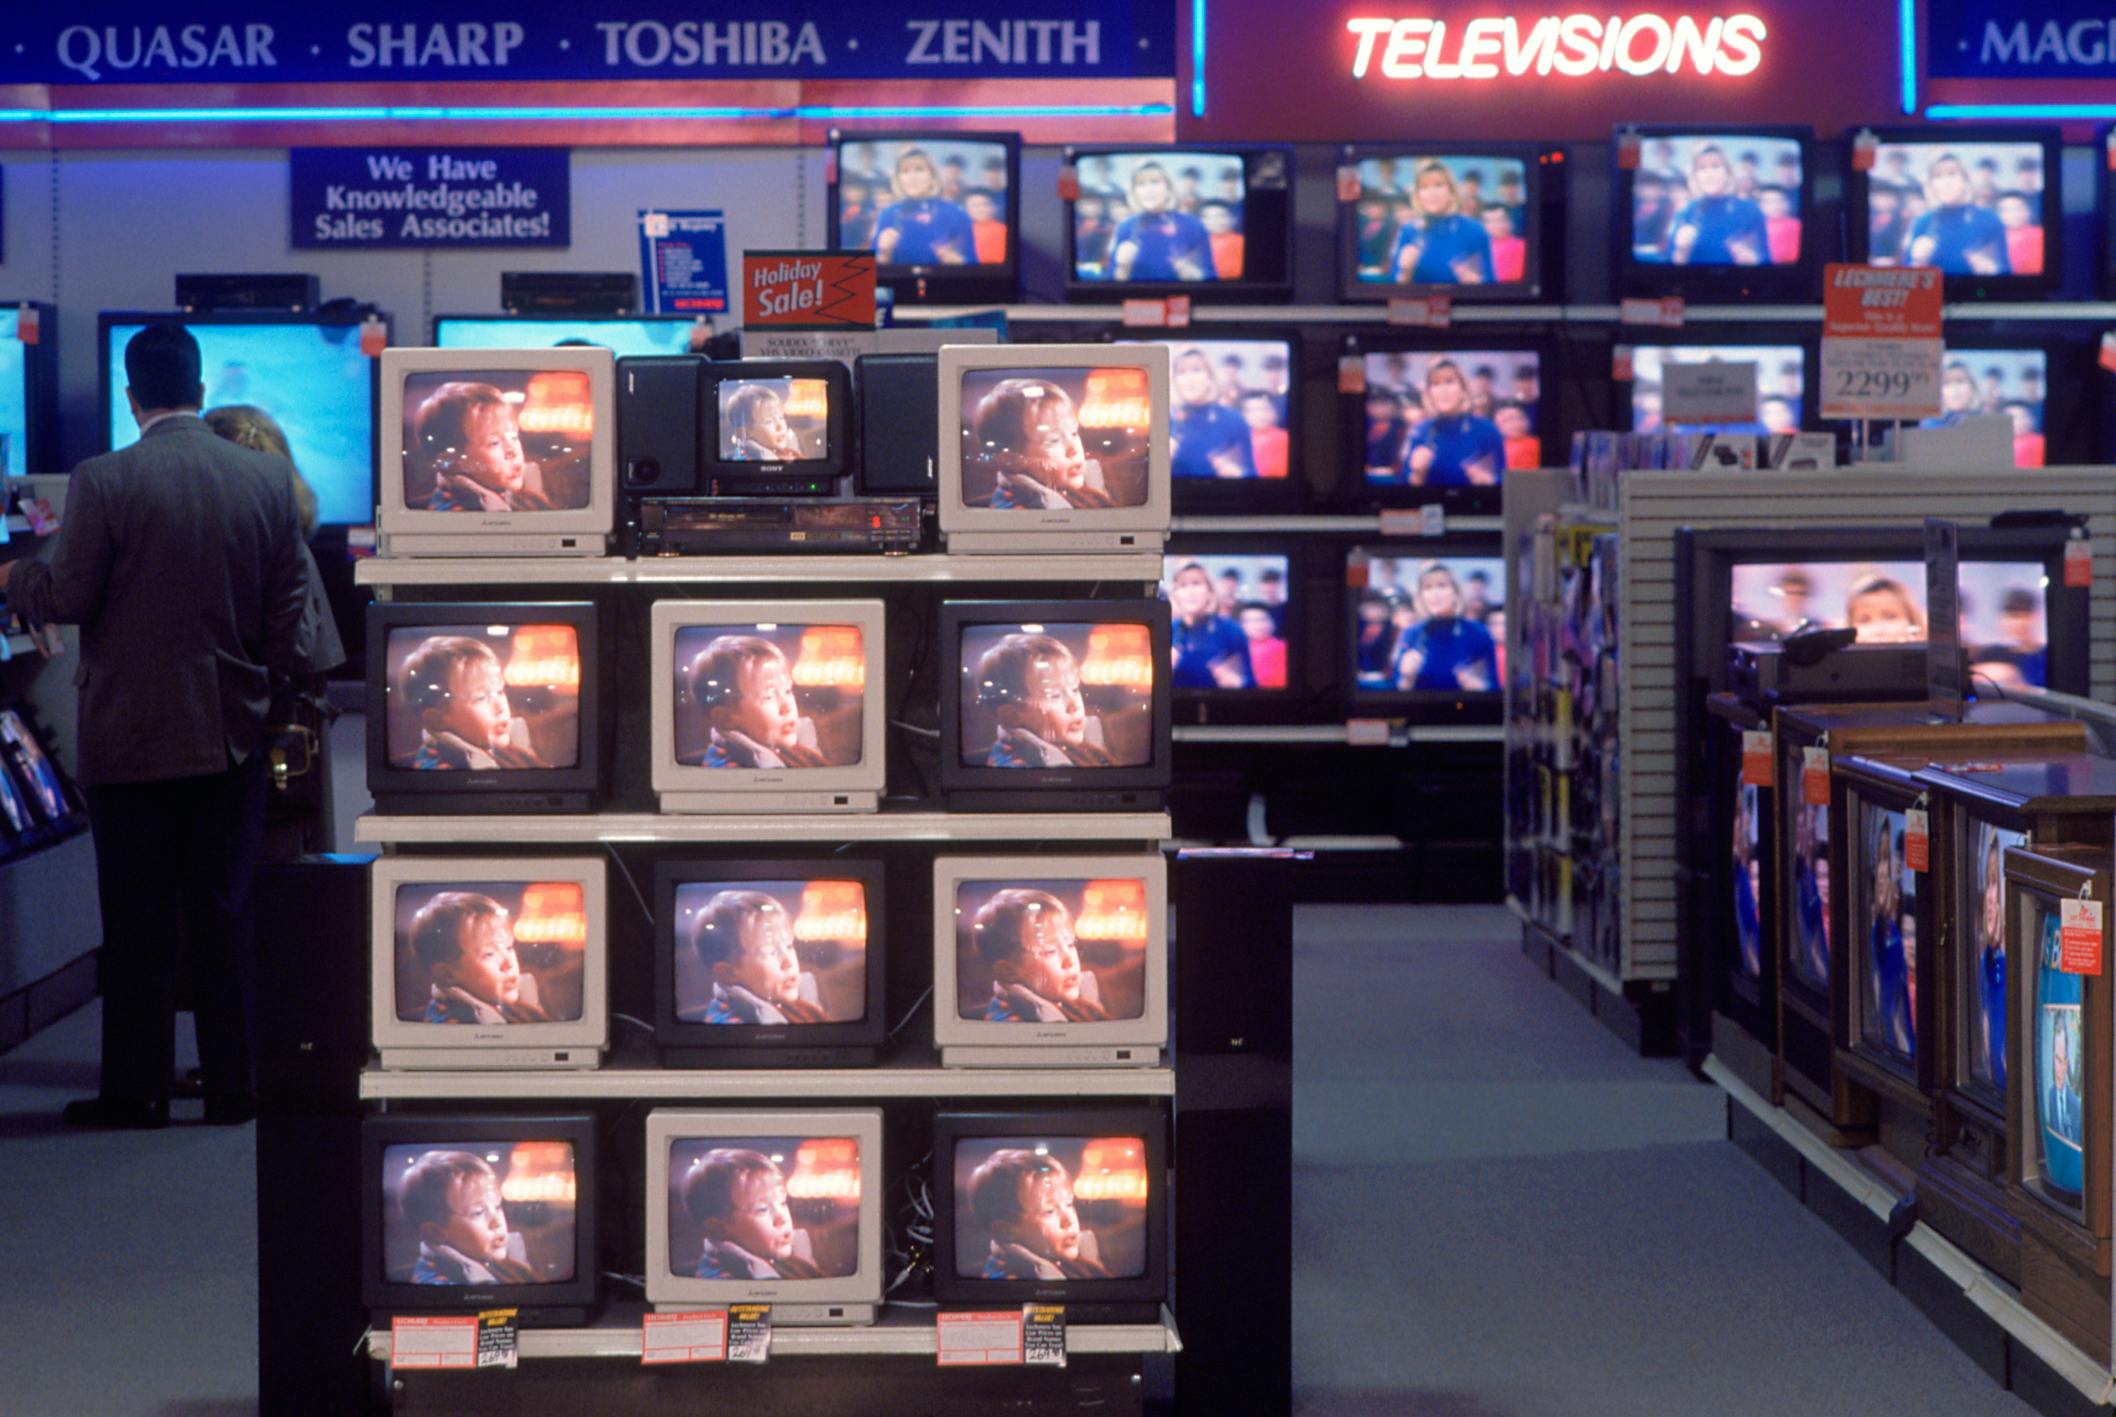
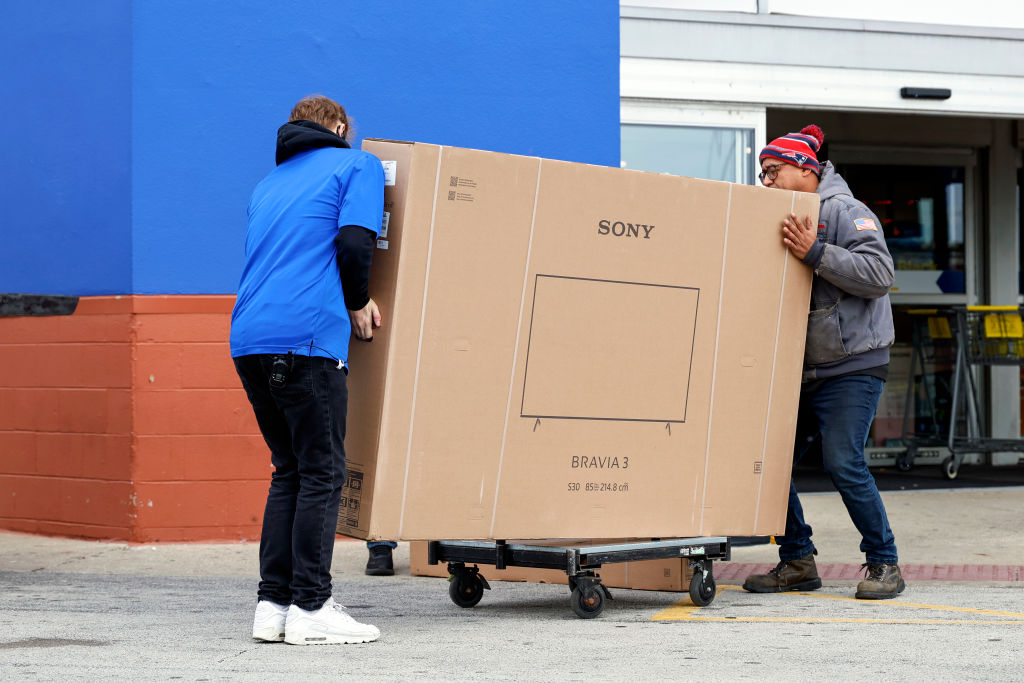
Televisions, for example…
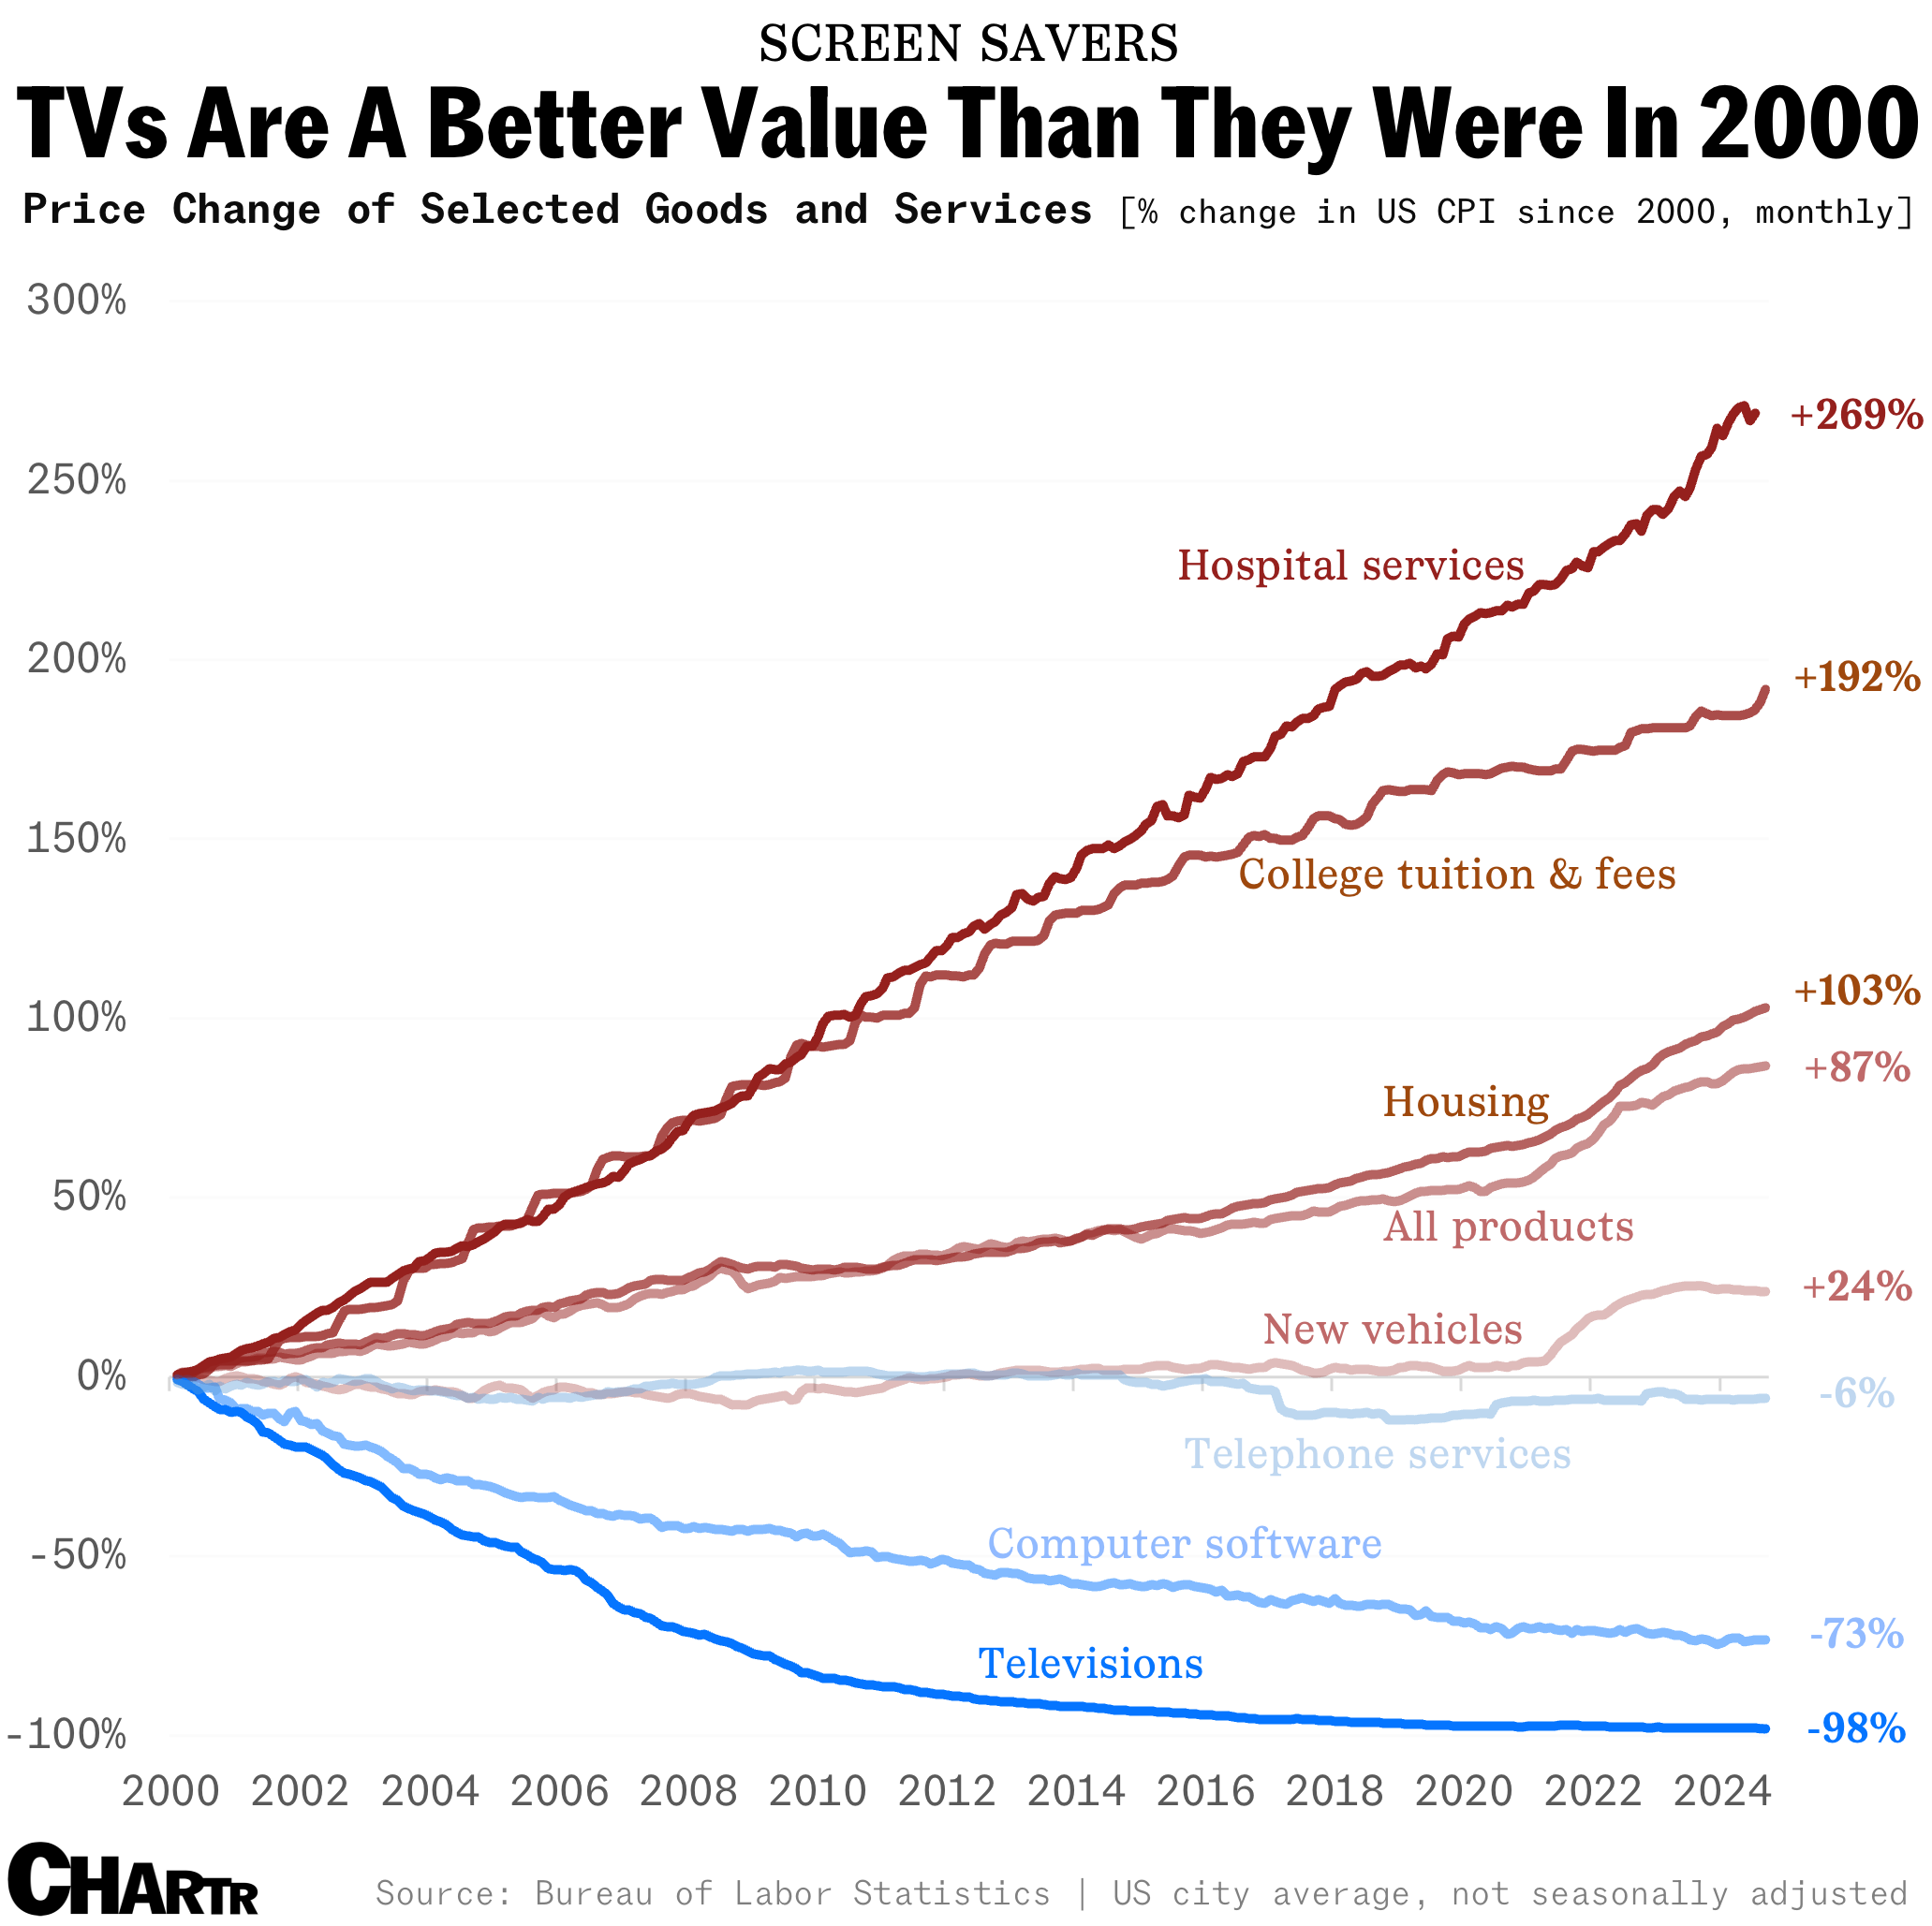
On the face of it, BLS data shows that television sets now cost 98% less than they did at the turn of the century, while the prices of other goods and services have skyrocketed in the same time frame. But as Steve Reed, an economist for the Bureau of Labor Statistics, explained to Sherwood News, it’s not quite that simple.
Think of a TV from the year 2000. It’s probably a big, ugly block sitting in the corner of a living room. Maybe there’s a VHS player sitting above or below it, there are buttons beneath the thick glass display, and the brand name is proudly displayed front and center on the box itself. Clearly things have moved on a lot in the world of televisions since then, and the BLS, specifically in the way it measures price points for the changing technology, has kept close behind.
For goods like televisions where the features and sometimes fundamental qualities of the product are changing all the time, the BLS makes “hedonic quality adjustments.” Put simply, when a product that the CPI trackers are observing is either updated or replaced entirely by a clearly superior version, the BLS adjusts its price point based on the new model and its enhanced features, taking the improvements into consideration as part of their assessment of whether the price is rising or falling. In the case of TVs, that means that things like larger displays, higher definition, and smart compatibility all likely weighed on the Bureau’s measurement through the years.
Reed told us, “Obviously televisions don’t literally cost 2% of what they used to,” explaining that quality adjustments are major reasons that goods like televisions and computers have trended in the opposite direction to many of the items in the CPI basket. Indeed, while you could quite easily go to any retailer on the market in 2024 and pick up a TV for as much as you’d have paid in 2000, the BLS’s measure accounts for the technology’s advance over the last couple decades, meaning that the standard of the set you could get for the price point has improved massively.
So, if the actual selling price of TVs hasn’t fallen by 98%... does this mean the CPI’s methodology is massively underestimating “true” inflation because of these quality adjustments?
The short answer is... no. That’s primarily because hedonic quality adjustments have only had a small impact on the CPI in aggregate, and sometimes the quality is being adjusted down (think: aging buildings and such). Furthermore, consider the most basic kind of quality adjustment: adjusting for size or quantity. Per the BLS piece “Addressing misconceptions about the Consumer Price Index,” from the Monthly Labor Review in 2008, which discussed the concept of shrinkflation before the term was widely used:
“To take the most straightforward example of quality adjustment, which the CPI handles automatically, suppose the maker of a 1.5-ounce candy bar selling for 75 cents replaces it by the same brand of candy bar, still selling for 75 cents, but weighing only 1.0 ounce. If the shrunken size is ignored, it looks like the price hasn’t changed. The CPI, however, prices candy and most other food items on a per-ounce basis and would automatically record a 50-percent increase in the quality-adjusted price of the item.”
Clearly, an index that blindly wrote down prices without any thought for quality or quantity would be less accurate.
The BLS has published a guide for American consumers on which items are quality adjusted and which aren’t; hedonic adjustments are just one subsection of the quality measures that the authority tracks.
What else are we getting wrong about the CPI?
From a technical standpoint, there’s a number of nuances about the CPI that are sometimes criticized, like hedonic quality adjustments. But arguably the most important misconception is that inflation is the same for all of us.
The BLS boils down over 80,000 items into a single price index, one that is reflective — as best as is practical to be — of the prices in America. The weighting in the index is based on surveys across the country that try to gauge how much people are spending on different goods and services.
But, because of life, liberty, and all that good stuff, everyone in the country spends their money on different things.
It’s pretty much a mathematical certainty.
Alcoholic beverages, for example, account for 0.841% of the CPI in the latest measurement. But what if you don’t drink — or, what if you’re a heavy drinker? That 0.841% is likely to be wrong in your own personal expenditure-inflation basket. Fruits and vegetables are 1.4%, but maybe you eat only a carnivore diet? Maybe you don’t drive a car, or rent a house, buy many new clothes, or have a pet.
Maybe you don’t eat eggs — which topped the inflation lists for many months — meaning that the fact prices are up 60% in recent years won’t have touched you, while your neighbor, who’s a six-egg omelette kinda guy, can’t believe just how bad things are getting this year.
The most impressive achievement of the CPI is that it boils down a wildly complex economy into exactly what people want: a simple barometer they can track with one number and can point to every month. That’s also, probably, it’s biggest drawback, too.