
Markets
Berkshire Hathaway’s Warren Buffett
Warren Buffett: old school (Bonnie Schiffman/Getty Images)

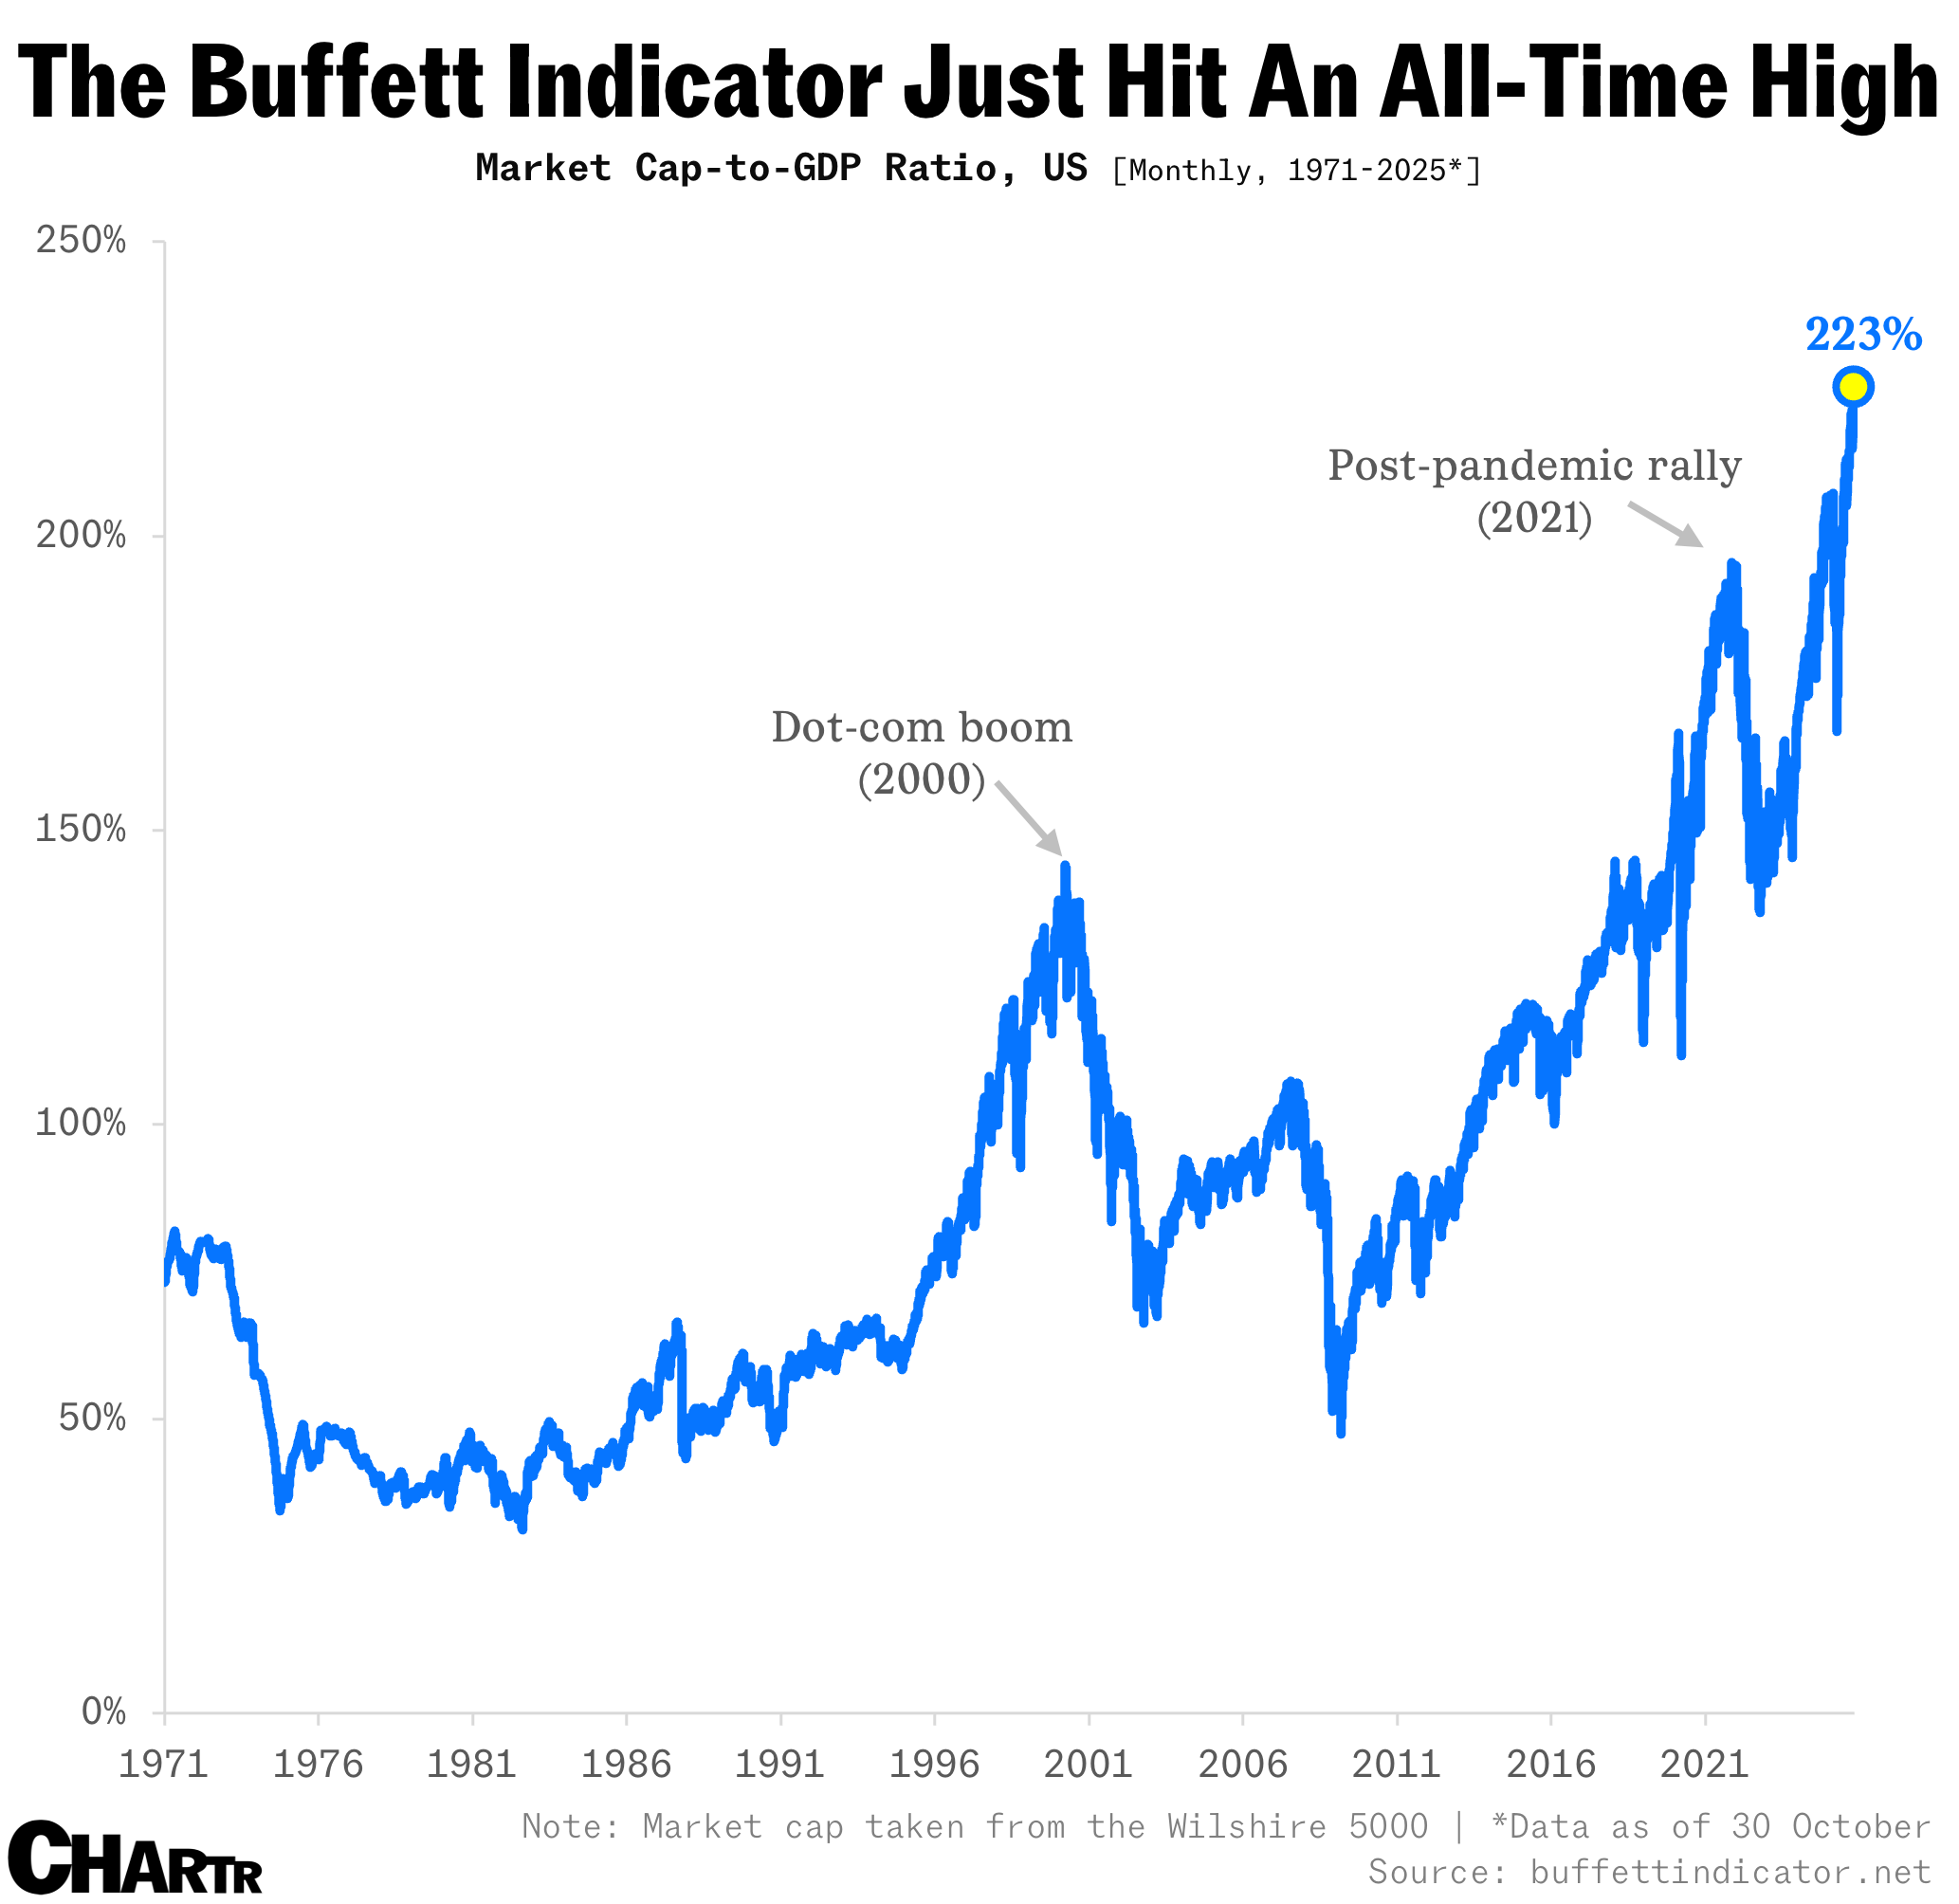
The Buffett Indicator just hit an all-time high

The simplest of all valuation metrics is flashing red; but there are reasons to ignore the alarm.

For most, comparing market caps to the GDP of a country is usually a bit of a no-no. GDP is a flow concept, economic activity over a year; market value, meanwhile, is a stock concept, just a snapshot of all the pieces of paper multiplied by their latest price.

But, as with all other disciplines, once you truly master the rules, you can break them — which is exactly what Warren Buffett did when he popularized the “Buffett Indicator,” the ratio of the total US stock market value to the country’s GDP.

Once hailed by its namesake investor as “probably the best single measure of where valuations stand,” that indicator just hit an alarm-ringing 225% its highest level on record, adding to the growing chorus of market commentators who think we might be in for a correction.
buffett indicator 2
Sherwood News

Time to worry?

Alongside the Buffett Indicator, other metrics are flashing amber or red, too. Investors are paying record prices for every dollar of future S&P 500 revenue, and the market is increasingly concentrated in a handful of megacaps, with eight tech stocks now responsible for ~40% of the S&P 500 Index’s value.

Back in 2001, Buffett warned that the metric nearing 200% would mean “playing with fire.” But, parallel to the valid concerns, there are very legitimate reasons to ignore this particular alarm.

For starters, America’s corporate giants are simply more global than ever — which makes their value look inflated relative to a purely domestic GDP. In fact, nearly half of the Magnificent 7’s revenue comes from overseas, per Goldman Sachs.

Furthermore, today’s corporate giants have never been better at turning revenue into profit, with the S&P 500 enjoying record operating profit margins, north of 14% on a forward basis, the highest ever. That’s why profit-based valuation measures are a little less scary — and they become almost entirely unremarkable once adjusted for future growth. The market’s PEG ratio is in a very typical range, for example (though you have to believe the forecasts, of course, which is a separate discussion altogether).

With that backdrop, throw in a dash of falling interest rates, a sprinkling of finally stable inflation, and an absolute fistful of AI hopes and dreams, and you get the record stock market of 2025 — and a Buffett Indicator of 225%.

More Markets

See all Markets
markets

SpaceX gets a wave of bullish ratings from Wall Street analysts

SpaceX received more than a dozen positive analyst calls on Tuesday — including from major Wall Street banks — as they initiate coverage on Elon Musk’s space and AI company.

SpaceX went public on June 12 at a $2.2 trillion valuation, the largest debut in history. While the company hasn’t yet posted a profit, it seems to have convinced Wall Street that it will get there and grow its valuation on the way.

Of the at least 17 analysts that gave a rating on Tuesday, all but one gave it a “buy” or “outperform” rating. MoffettNathanson was "neutral."

The ratings come as SpaceX joined the Nasdaq 100 index, a benchmark tech-heavy basket of companies that underpins millions of portfolios. The inclusion adds built-in demand for the stock from index funds and ETFs.

Still, SpaceX fell more than 5% on Tuesday amid a broader sell-off, and is currently effectively flat from its opening price of $150 a share.

markets

Nike sinks to lowest level since 2014 after warning of “challenged” sales environment in Q4 report

Did Nike do it?

Investors had a mixed reaction after the global sports apparel company reported its fourth quarter earnings on Tuesday after the bell. Shares initially rose 5% as Nike beat out Wall Street expectations amid a hefty tariff refund bonus. However, the stock then sank to its lowest level since August 2014 in postmarket trading.

Here are the Q4 numbers:

  • Revenue of $11.0 billion (estimate: $10.8 billion).

  • Adjusted earnings per share of $0.20 (estimate: $0.12).

Ahead of this report, Nike warned that results would be flattered by a one-time tariff refund (now estimated at roughly $0.52 per share for the bottom line). That gave the company an extra cushion in snapping its streak of seven quarters of year-over-year profit declines.

Over the past year, the company had been punished by tariffs on imported goods, stagnant consumer spending, and increasing competition from other footwear brands like New Balance, Adidas, and Hoka.

Outgoing CFO Matthew Friend deemed it an “increasingly challenging operating environment, where sell-through remains challenged.”

Latest Stories

Sherwood Media, LLC and Chartr Limited produce fresh and unique perspectives on topical financial news and are fully owned subsidiaries of Robinhood Markets, Inc., and any views expressed here do not necessarily reflect the views of any other Robinhood affiliate, including Robinhood Markets, Inc., Robinhood Financial LLC, Robinhood Securities, LLC, Robinhood Crypto, LLC, Robinhood Money, LLC, Robinhood U.K. Ltd, Robinhood Derivatives, LLC, Robinhood Gold, LLC, Robinhood Asset Management, LLC, Robinhood Credit, Inc., Robinhood Ventures DE, LLC and, where applicable, its managed investment vehicles.